Feb 19 2016
By developing this method, the international team of researchers has been able to map which areas are most sensitive to climate variability across the world.
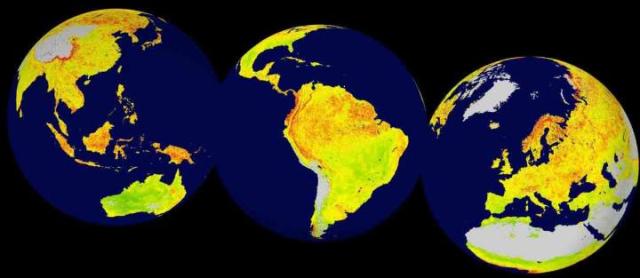
 Global map of the Vegetation Sensitivity Index (VSI), a new indicator of vegetation sensitivity to climate variability using satellite data. Red colour shows higher ecosystem sensitivity, whereas green indicates lower ecosystem sensitivity. Grey areas are barren land or ice covered. Inland water bodies are mapped in blue.
"Based on the satellite data gathered, we can identify areas that, over the past 14 years, have shown high sensitivity to climate variability," says researcher Alistair Seddon at the Department of Biology at the University of Bergen (UiB).
Seddon is first author of the paper Sensitivity of global terrestrial ecosystems to climate variability, which has just been published in the journal Nature.
Globe-spanning results
The approach of the researchers has been to identify climate drivers of vegetation productivity on monthly timescales. The researchers have found climate sensitivity in ecosystems around the globe.
"We have found ecologically sensitive regions with amplified responses to climate variability in the Arctic tundra, parts of the boreal forest belt, the tropical rainforest, alpine regions worldwide, steppe and prairie regions of central Asia and North and South America, forests in South America, and eastern areas of Australia," says Seddon.
Creating a sensitivity index
The metric they have developed, the Vegetation Sensitivity Index (VSI), allows a more quantifiable response to climate change challenges and how sensitive different ecosystems are to short-term climate anomalies; e.g. a warmer June than on average, a cold December, a cloudy September, etc. The index supplements previous methods for monitoring and evaluating the condition of ecosystems.
"Our study provides a quantitative methodology for assessing the relative response rate of ecosystems, either natural ones or those with a strong anthropogenic footprint, to climate variability," Seddon explains.
Using satellite data to get results
For their study, the researchers have used satellite data from 2000 to 2013, and Seddon describes their method.
"First of all, the method identifies which climate related variables such as temperature, water availability, and cloudiness are important for controlling productivity in a given location," says Seddon.
"Then we compare the variability in ecosystem productivity, which we also obtain from satellite data, against the variability in the important climate variables."
VSI provides an additional vegetation metric that can be used to assess the status of ecosystems globally scale.
"This kind of information can be really useful for national-scale ecosystem assessments, like Nordic Nature," Seddon states.
"Even more interesting is that as satellite measurements continue and so as the datasets get longer, we will be able to recalculate our metric over longer time periods to investigate how and if ecosystem sensitivity to climate variability is changing over time."