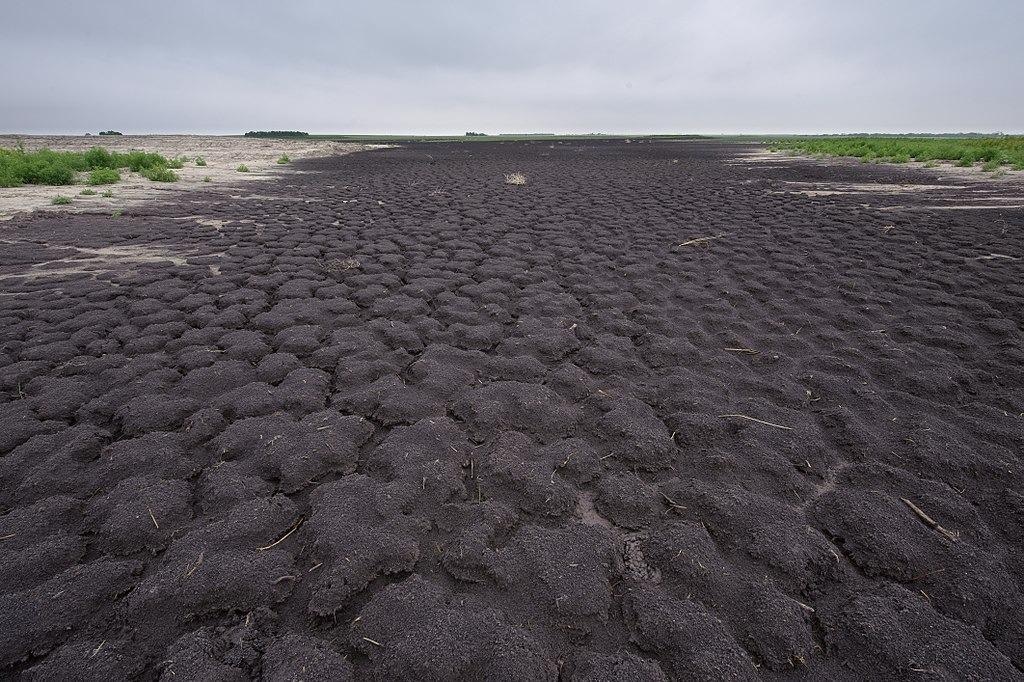
One of the worst droughts ever experienced by Texas occurred in 2011. The dry, arid conditions caused over $7 billion in crop and livestock losses, pushed power grids to the maximum, triggered wildfires and decreased reservoirs to hazardously low levels.
 The 2011 drought devastated the state. A new study shows that it was even more severe and lasted longer than previously thought. Image Credit: U.S. Department of Agriculture.
Also, based on a recent study headed by geoscientists at The University of Texas at Austin, the drought was worse compared to what was earlier thought.
The study included integrated extra soil moisture-related data from gravity and microwave sensors on satellites into a land surface model utilized by researchers to identify the severity of droughts.
The study was reported in the Journal of Hydrology.
As per the updated model simulation, severe drought was more common and lasting for a longer time compared to what was judged by the U.S. Drought Monitor (USDM). This is known to be the present standard for designating drought throughout the United States.
The development of technology has allowed us to gain more real-time observation, and this observation can more accurately reflect the ground conditions.
Weijing Chen, Study Lead Author and Postdoctoral Researcher, Jackson School of Geosciences, The University of Texas at Austin
Although a decade has gone by since the 2011 drought, the study's findings are significant since they show that integrating new sources of data related to soil moisture into a present land surface model can more precisely anticipate the severity and effect of droughts.
Soil moisture is considered to be a main indicator of drought and is also one of the most essential factors when it comes to a drought’s effect on agricultural production.
Several indexes, data sources and expertise have been integrated by the USDM to generate its findings, such as a hydrological model that provides an estimate of an area’s soil moisture. The scientists from UT took their model to the next level by making use of data assimilation technology to integrate a combination of real-time satellite measurements connected to soil moisture into their model.
The microwave satellite data showed measurements of the top two inches of soil moisture. Incorporating the gravity satellite data provided them soil moisture measurements in the rest of the root zone — down to around 40 inches.
Soil moisture in the root zone is very important because it determines the water supply for vegetation.
Weijing Chen, Study Lead Author and Postdoctoral Researcher, Jackson School of Geosciences, The University of Texas at Austin
A map has been released by the USDM every week that displays what parts of the US are in a drought. It is generated by the National Drought Mitigation Center at the University of Nebraska-Lincoln, the National Oceanic and Atmospheric Administration and the U.S. Department of Agriculture. Its outcomes are used to activate disaster declarations and other federal, state and local responses.
Chen together with her group integrated the satellite data into a present land surface model utilized by scientists throughout the world. Further, they zeroed in on what that meant for the Texas drought that occurred from 2010 to 2013.
The updated model simulation and the USDM were like-minded when the geographical extent of the drought was concerned. However, the updated model simulation illustrated that several areas were undergoing more severe drought compared to what was determined by the USDM, especially in the western half of the state. Also, the new model discovered that extensive drought started in 2010, well in advance compared to the USDM.
Furthermore, the results also vary in what was the worst week of the historic drought. For the USDM, it was the week of October 4th, 2011, having the most severe category of the drought affecting 87.99% of the state. For the new model, it was the week of April 5th, 2011, with 95.1% of the state undergoing the most severe category of drought.
The scientists stated that developing techniques for gaining better insights into droughts is essential to Texas as policymakers try to find how the water resources of the state will be impacted by climate change and population growth.
Using measurement from space is a clever way to be able to more realistically detect and monitor droughts.
Zong-Liang Yang, Study Co-Author and Professor, Jackson School of Geosciences, The University of Texas at Austin
Also, the study was co-authored by Chunlin Huang of the Chinese Academy of Sciences. The research was financially supported by the Chinese Academy of Sciences and the UT Austin-Portugal MAGAL Constellation Project.
Journal Reference:
Chen, W., et al. (2021) More severe drought detected by the assimilation of brightness temperature and terrestrial water storage anomalies in Texas during 2010–2013. Journal of Hydrology. doi.org/10.1016/j.jhydrol.2021.126802.